This article will tell you how to create an organizational assessment.
Table of Contents:
Creating an Organizational Assessment:
- Login to your imPowr website
- Go to the Performance menu
- Click on Assessment Tools in the Planning section

- Click on New Assessment Tool

To view if an Assessment has already been created (so you can modify it),
either…
-
Enter a Name
-
Select a Typefrom the drop down list
- Aggregated Style: an assessment that combines the scores from one or more assessments and calculate a new score
- Grid Style: a stand-alone assessment
-
Select whether your Assessment is Active or not
-
Click the Refresh icon

If you wish to create a new Assessment…
- Click on the New Assessment Tool button

-
Enter a Name for the Assessment
-
Select the Assessment Typefrom the drop-down list
- Aggregated Style: an assessment that combines the scores from one or more assessments and calculate a new score
- Grid Style: a stand-alone assessment

- Select a Category from the user configurable drop-down list:

- Set the Status by checking the Active box
- Enter a Short Description
- Enter a Long Description

- Click on Apply
- Enter a Design for the Assessment by selecting the Design tab and…
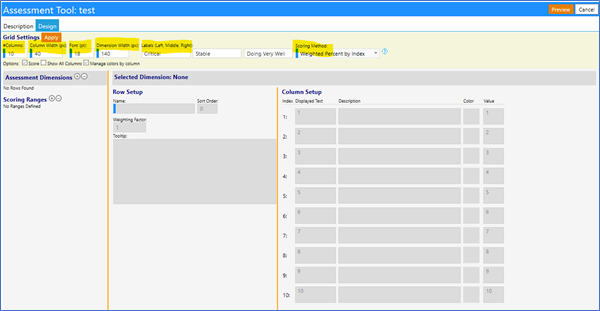
Review the following Grid Settings defaulted values and make changes, if
necessary:
- number of columns(currently defaults to 10)
- column widthin pixels (currently defaults to 40 [approx. 0.45 inches])
- font (currently defaulted to 18 point)
- Dimension Width in pixels (currently defaults to 140 [approx. 1.45 inches]). This reflects the width of the column where the Dimension is located
Note: the “Dimension” is the row in the table (refer to example)
- Left Label (currently defaulted to “Critical”)
- Middle Label (currently defaulted to “Stable”)
- Right Label (currently defaulted to “Doing Very Well”)
- Scoring Method (currently defaulted to “Weighted Percent by Index”)
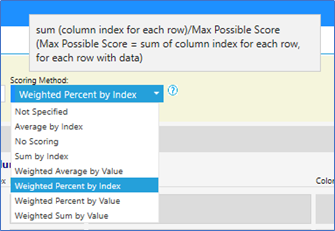
Note: the Scoring Method may be changed by selecting a method from the drop-
down list. By highlighting one of the methods with your cursor, and then
hovering over the information button, you can view a tooltip which explains
the calculation in greater detail
Scoring Method:
Notes:
-
Only 1 number (column) may be selected in each row
- If no selection is made, that row is ignored and is not considered in the scoring
-
The Index of each column, in each row, is equal to the number of the column
-
The Value of each column in each row, is set on a per row basis
-
The text displayed in each column, in each row, is arbitrary and has no impact on the scoring
-
The weighting factor is set on each row
-
“Dimensions” are the rows of the Assessment
Example: Average by Index:
Average of (Column Index for each row)
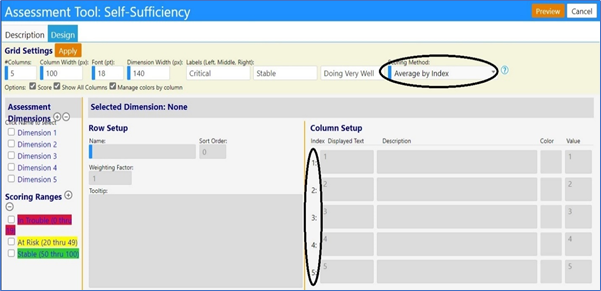
The column index numbers in each row (Dimension) are averaged (regardless of
the weighting factor or the value entered for each column in that row).
Basically, this is just an average of the selected columns in each row
(Dimension) since the index of each column is equal to that column number
Example:

Index of row 1, column 1 = 1
Index of row 2, column 3 = 3
Index of row 3, column 4 = 4
Index of row 4, column 2 = 2
Index of row 5, column 4 = 4
Average by Index = (1 + 3 + 4 + 2 + 4)/5 (rows) = 14/5 = 2.8
Since the score of 2.8 falls within the “0 – 19 scoring range” (Scoring Ranges
are discussed further on in this document), the score is displayed in pink
Example:

Index of row 1, column 1 = 1
Index of row 2, column 3 = 3
Index of row 3, = Blank (ignored)
Index of row 4, column 2 = 2
Index of row 5, column 4 = 4
Average by Index = (1 + 3 + 2 + 4) / 4 (rows) = 10/4 = 2.5
Since the score of 2.5 falls within the 0 – 19 scoring range (this is
discussed further on in this document), the score is displayed in red
Example: No Scoring:
[Score as 0 and do not show]
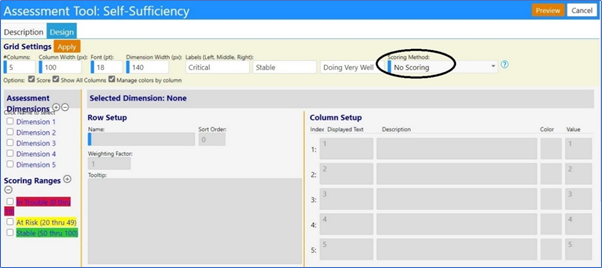
The column index numbers for each row (Dimension) are not scored. Basically,
this just displays your grid – the score is not displayed
Example:

Example: Sum by Index:
Sum of (Column Index for each row)
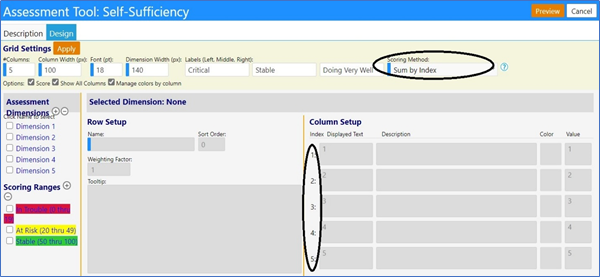
The column index numbers for each row (Dimension) are summed (regardless of
the weighting factor or the value entered for that column in each row):
As previously mentioned, rows with no column selection are ignored:
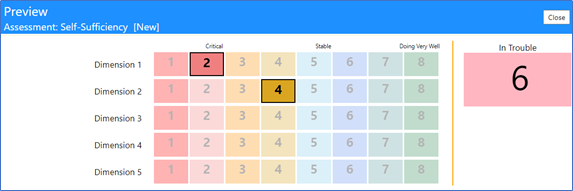
Index for row 1, column 2 = 2
Index for row 2, column 4 = 4
Index for row 3 = blank (ignored)
Index for row 4 = blank (ignored)
Index for row 5 = blank (ignored)
Sum by Index = 2 + 4 = 6.
Since the score of 6 falls within the 0 – 19 scoring range (Scoring Range to
be discussed further on in the document), the score is displayed in pink
Example: Weighted Average by Value:
Average of (Column value * weighting factor)
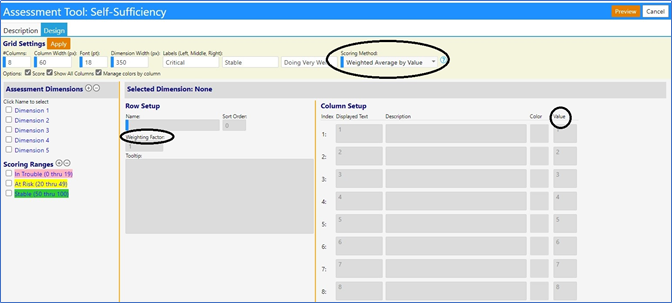
The selected column value numbers in each row (Dimension) are multiplied by
the weighting factor for that row. The value for each row is then summed, and
then that number is averaged. Basically, this is just an average of the
weighted average row (Dimension) values
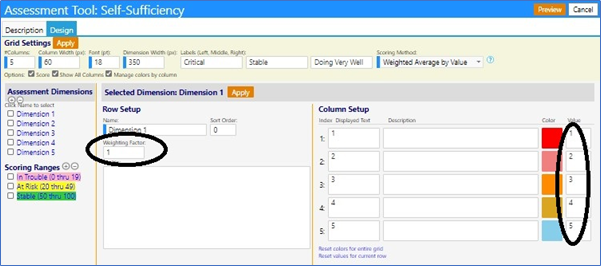
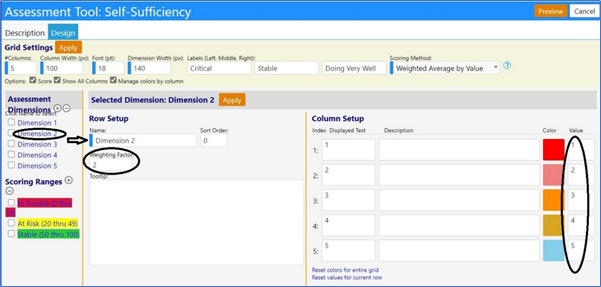
Note: In the following example, we will assume we have set the weighting
factor of Row 2 (Dimension 2) = 2; all other rows (Dimensions) have a
weighting factor of 1. Additionally, the value of each column in each row, is
equal to the Index or Column number
Example Row 1 set-up: (Rows 3 – 5 are similar)
Example Row 2 set-up:
Example:

The value of row 1, column 3 is 3; the weighting of row 1 = 1
The value of row 2, column 2 is 2; the weighting of row 2 = 2
The value of row 3, column 4 is 4; the weighting of row 3 = 1
The value of row 4, column 4 is 4; the weighting of row 4 = 1
The value of row 5, column 4 is 4; the weighting of row 5 = 1
Weighted Average by Value = ((31) + (22) + (41) + (41) + (4*1)) / (5 rows)
= 19/5 = 3.8
Since the score of 3.8 falls within the 0 – 19 scoring range (Scoring Range
will be discussed further in the document), the score is displayed in pink
Example: Weighted Percent by Index:
Sum (Column Index for each row) / Maximum possible score
(Maximum possible score = maximum value for each row), for each row with data
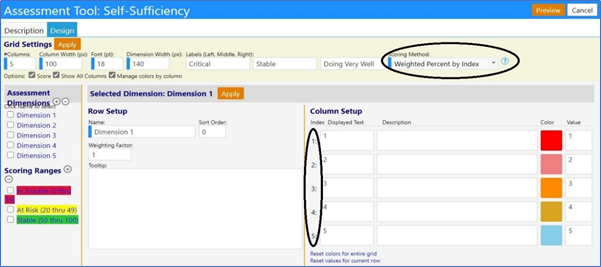
The indexes for the selected columns in each row (Dimension) are summed, and
then divided by the sum of the maximum possible values for those rows (recall
that rows without selections are ingored). The result is then viewed as a
percentage. Note in this scoring method, the weighting is not considered for
the calculation
Note: In this example, we will assume the index of each column in each row, is
equal to the column number

The index of row 1, column 3 is 3; the weighting is = 1, the maximum possible
index number is 5
The index of row 2, column 4 is 4; the weighting is = 2, the maximum possible
index number is 5
The index of row 3, column 2 is 2; the weighting is = 1, the maximum possible
index number is 5
The index of row 4, column 5 is 5; the weighting is = 1, the maximum possible
index number is 5
The index of row 5, column 3 is 3; the weighting is = 1, the maximum possible
index number is 5
Weighted Percent by Index = (3 + 4 + 2 + 5 + 3) / (5 + 5 + 5 + 5 + 5) = 17/25
= 0.68 = 68%
Since the score of 68 falls within the 50 - 100 scoring range (Scoring Range
will be discussed further in this document), the score is displayed in green
Example with missing responses: (As previously mentioned, rows with no column
selection are ignored)

The index of row 1, column 3 is 3; the weighting is = 1, the maximum possible
index number is 8
The index of row 2, column 7 is 7; the weighting is = 2, the maximum possible
index number is 8
The index of row 3, column 5 is 5; the weighting is = 1, the maximum possible
index number is 8
The index of row 4 is Blank (ignored)
The index of row 5, column 7 is 7; the weighting is = 1, the maximum possible
index number is 8
Weighted Percent by Index = (3 + 7+ 5 + 7) / (8 + 8 + 8 + 8) = 22/32 = 0.6875
= 68.8%
Since the score of 68.8 falls within the 50 - 100 scoring range (Scoring Range
will be discussed further in this document), the score is displayed in green
Example: Weighted Percent by Value:
Sum of (Column value * weighting factor)/Maximum possible score (Maximum
possible score = maximum value for each row), for each row with data
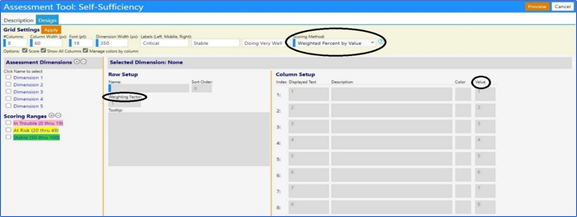
The selected column value numbers in each row are multiplied by the weighting
factor for that row. The value for each row is then summed and divided by the
maximum sum of value for the rows which had data in them
Basically, this is just a sum of the weighted average row values divided by
the sum of the maximum value for those rows – converted to a percentage number
Note: in the following example, we will assume we have set the weighting
factor of Row 2 (Dimension 2) = 2; we have also changed the values for Row 2.
All other Dimensions (Rows) have a weighting factor = 1 and values equal to
the column number
Rows 1, 3 - 5: Weighting factor = 1, Values are equal to the column number or
Index:
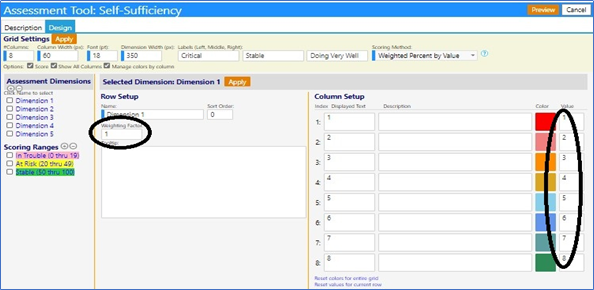
Row 2: Weighting factor = 2
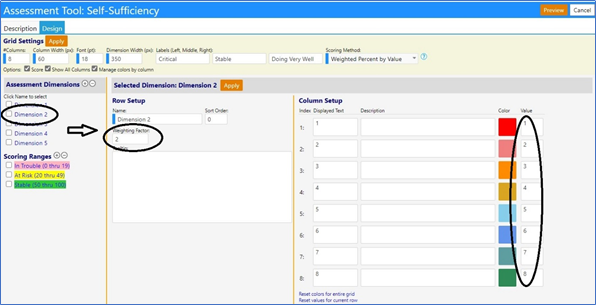
Example:

The value of row 1, column 2 is 2; the weighting of row 1 = 1
The value of row 2, column 4 is 4; the weighting of row 2 = 2
The value of row 3, column 2 is 2; the weighting of row 3 = 1
The value of row 4, column 6 is 6; the weighting of row 4 = 1
The value of row 5, column 4 is 4; the weighting of row 5 = 1
Weighted Percent by Value = ((21) + (42) + (21) + (61) + (4*1)) / (8 + 8 +
8 + 8 + 8) = 22/40 = 0.55 = 55%
Since the score of 55 falls within the 50 – 100 scoring range (Scoring Range
to be discussed further in the document), the score is displayed in green
Example: Weighted Sum by Value:
Sum of (Column value * weighting)
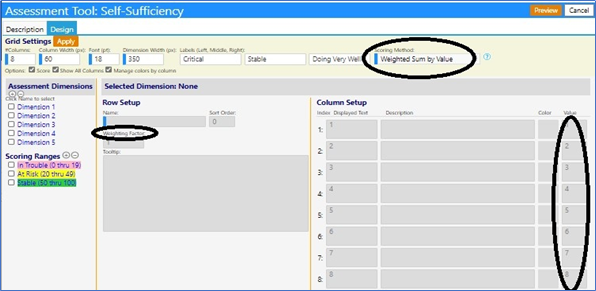
The selected column value numbers in each row are multiplied by the weighting
factor for that row. The value for each row is then summed
Note: in the following example, we will assume we have set the weighting
factor of Row 2 (Dimension 2) = 2; we have also changed the values for Row 2.
All other Dimensions (Rows) have a weighting factor = 1 and values equal to
the column number
Rows 1, 3 - 5: Weighting factor = 1, Values are equal to the column number or
Index:
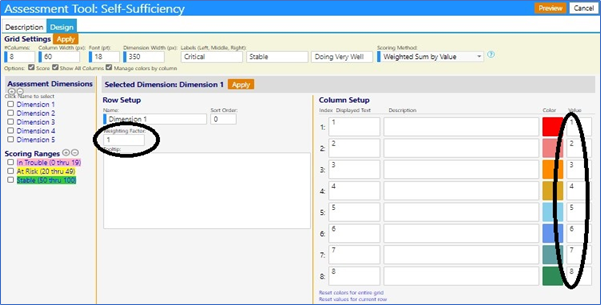
Row 2 set-up: Weighting factor = 2:
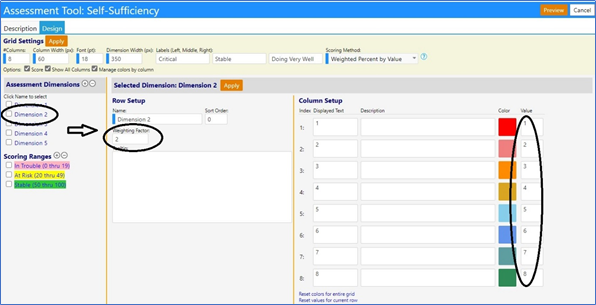
Example: (As previously mentioned, rows with no column selection are ignored)

The value of row 1, column 2 is 2; the weighting of row 1 = 1
The value of row 2, column 3 is 3; the weighting of row 2 = 2
The value of row 3, column 6 is 6; the weighting of row 1 = 1
The value of row 4, is blank (ignored)
The value of row 5, column 4 is 4; the weighting of row 1 = 1
Weighted sum by value = ((21) + (32) + (61) + (41)) = 18
Since the score of 18 falls within the 0 – 19 scoring range, the score is
displayed in pink
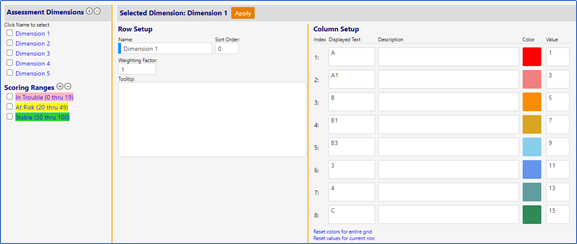
Difference between Index, Column Text, and Value:

- The Index reflects the column number. It is the same for every row and it cannot be changed. When scoring is based on the Index, the scoring ignores the value of that cell or what is displayed in the cell.
- The Displayed Text is optionally entered to be displayed in the row/column grid cell. It can be numbers, letters, or a combination of numbers and letters. It is for display only and is not used in any scoring calculations.
- The Value is a number that you assign to the cell in that row/column grid. It is used in scoring calculations only when they are based on Values. It is an optionally entered number that defaults to the column number, but can be changed to anything you want or be left blank.
Example of using letters for the displayed text and modifying the values:
Note that the text does not come into play in the scoring – in this example
the text for row 1 (Dimension 1), column 2 was changed from its default of
“2”.
When we score this using a Weighted Sum by Value, only the Value comes into
play in the scoring calculation. The Index and Displayed Text are ignored.
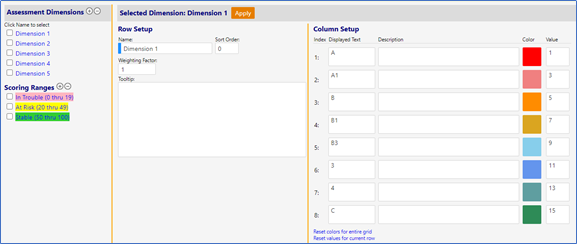

When we score this using a Sum by Index, only the Index comes into play in the
scoring calculation – the displayed text and the Value are ignored.
